
KLM – Performance Forecast of a Flight Schedule #SWI2003
In search of a quick method to forecast the quality of a flight schedule
Situation
KLM flies to over 150 destinations with 97 aircraft. Four times a year, a new flight schedule is developed. Though the operational feasibility is taken into account up to a certain degree during the development process, the aim at that stage is mostly to maximize the number of seats that can be sold. During schedule development, KLM considers various commercial aspects such as the expected demand per destination and the number of possible transfer connections at Schiphol Airport.
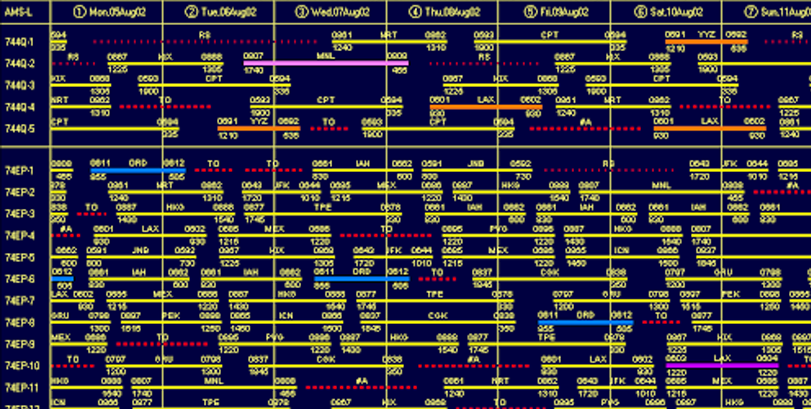
The schedule is usually published as an Aircraft Rotation Schedule. This is a diagram that shows how flights are assigned to the 97 aircraft. The figure below shows an example. This Rotation Schedule is different each week. This is because each day many adaptations are made so as to minimize delays. For instance, if we know that an aircraft will arrive at Schiphol Airport with a delay, we could try to assign its next flight to another aircraft so that that flight can still leave on time. Usually, we will then need a couple of other adaptations to have all flights fit in the Rotation Schedule again. When a schedule is first published, we don’t know the exact layout of the Rotation Schedule, so we publish a hypothetical “average” one instead.
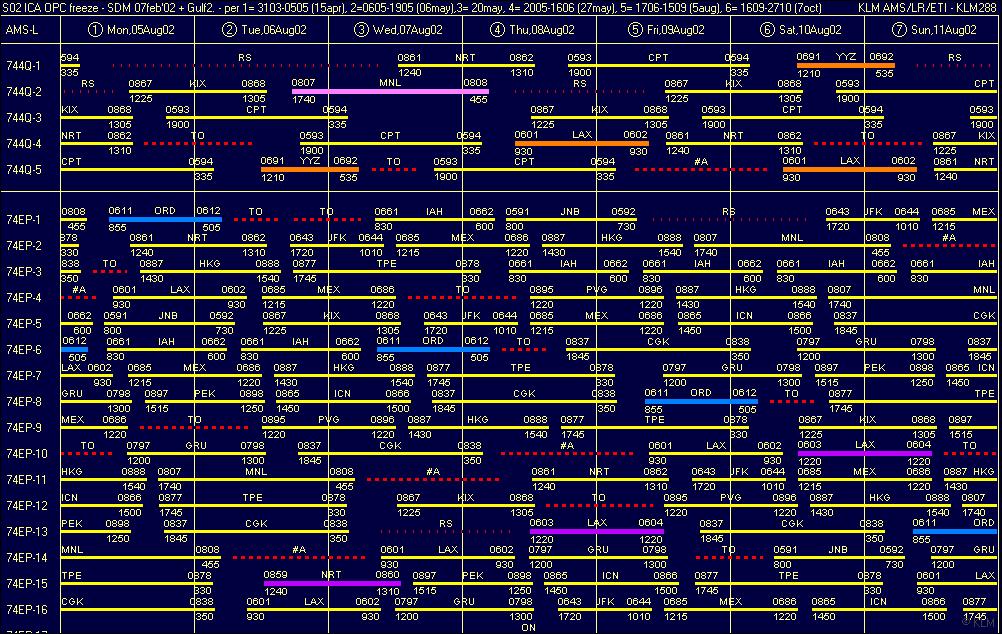
Part of an Aircraft Rotation Schedule as commonly published within KLM. Each row represents the assignment of an aircraft. The coloured lines display various activities (flights, maintenance, reserves).
Before a schedule is published, an estimation of the expected punctuality -that is the percentage of “on time” flights – is performed using a simple deterministic model. Because this model lacks accuracy, a simulation model is currently being developed in order to enable a better forecast. This model simulates aircraft movements according to a given schedule. The model subjects the schedule to a “stress test” by generating various disruptions such as air traffic congestion, delays during the boarding process or unexpected problems during maintenance. Throughout the simulation, a Problem Solver tries to resolve delays by swapping flights in the Rotation Schedule, or in extreme cases by canceling them. The better he succeeds, the better the schedule is considered fit to be flown. The schedule is assessed according to the punctuality that can be achieved in this way and to the number of cancellations.
A simulation, though, has several disadvantages. Processing times usually are long, which limits the number of scenarios that can be simulated at one time. Also, we need to collect a lot of data about the processes that are being simulated. For the simulation model currently under development, we need statistics about the variation in the actual flight duration, about the variation in the time it takes to handle an aircraft on the ground (boarding, fuelling, catering, etc.), about break downtimes of each aircraft type, and so on. Each of these statistics must constantly be updated to reflect the change in flight routes, working methods, fleet, etc.
We would be very happy if we had a simple model that would enable us to make a comparative statement, such as:
“Of a number of alternative schedules, schedule X will provide the best performance.”
Question
Is there a simpler method to evaluate the performance of a given flight schedule?