
NMi Van Swinden Laboratorium – The T-factor for a Non Gauss-distribution #SWI1998
For a small sample from a normal or Gauss-distribution, it has been derived by Student with which factor one has to multiply the standard deviation of the sample such that, with a certain probability, the center of the distribution is found in the interval on both sides of the average of the sample, with size given by the standard deviation multiplied by this `t-factor’. Or, in other words, the question is for which part of all possible samples of a specified size, is the center of the distribution found within the interval that is determined using the t-factor.
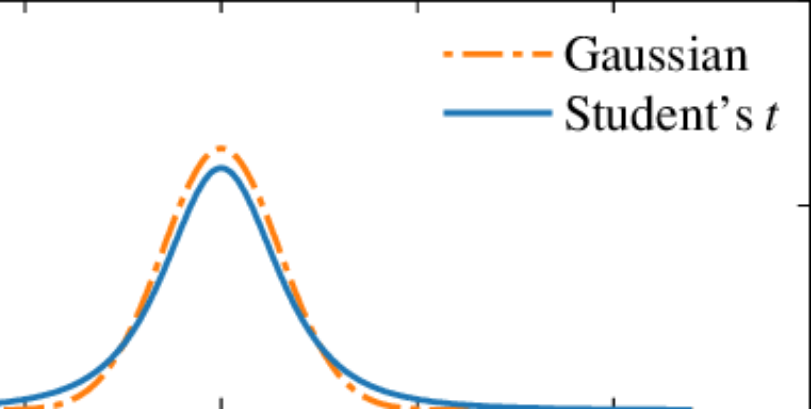
If the arbitrary variable z has a probable value of µ_z according to the normal distribution, and if Z is the average of n observations and s(Z) is the standard deviation of Z, then the distribution of (Z-µ_z)/s(Z) according to Student’s t-distribution with v=n-1 is:
p(v,t)=1/sqrt(pi v) G((v+1)/ 2) / G(v/2) – (1+t^2/v)^(v+1)/2, -infinity<t<infinity,
where G is the gamma function and v>0. The expectation of the t-distribution is zero and the variance is v/(v-2). For v-> infinity the t-distribution approaches a normal distribution with µ=0 and sigma=1.
This function has been calculated numerically and the tables made in this way are used regularly in studies on the uncertainty of measurements.
However, for the necessary assumption that the results of repeated measurements are distributed normally, there is very often no ground. Even more, in practice, one hardly ever observes that the histogram of measurement results corresponds to a normal distribution. In particular, the results in the far tails of the normal distribution are almost never present. One finds instead results in a finite interval with a distribution that resembles a triangle with a somewhat rounded top.
The question arises what is the factor for a triangular or even a rectangular distribution, that corresponds to the t-factor. So, with which factor does one multiply the standard deviation of a sample of a fixed size from a triangular or rectangular distribution, so that with a given probability the so determined interval around the average of the sample contains the center of the distribution.
When the answer to this question is known, it is likely that a large improvement is made in the reliability of determining uncertainties on the basis of a small number of repeated measurements, and this can have important social consequences, such as economic due to larger reliability in margins in production, or in safety margins and the interpretation of diagnostic measurements.
Literature:
Guide to the expression of uncertainty in measurement, ISO, Genève, 1993, ISBN 92-67-10188-9.