
Regge en Dinkel – Mathematical challenge waterboard #SWI2008
Mathematical challenge waterboard Regge en Dinkel
The waterboard Regge en Dinkel is responsible for the watermanagement of 1300 km2 in the
eastern part of the Netherlands. The expected climate change will affect the watersystem; more and
heavier rainfall will result in increasing discharge en flooding. The waterboard has three strategies
to deal with these problems:
1. Prevent the extra rainfall from turning into more discharge.
2. Store the extra discharge in designated areas.
3. Drain it off in the fastest way.
Possible measures are meant to prevent local and downstream flooding. As the waterboard spills
the water to one downstream river (de Vecht), it is not allowed to raise the peak-discharge.
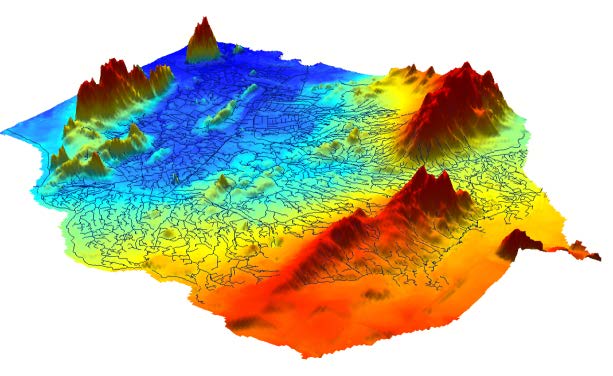
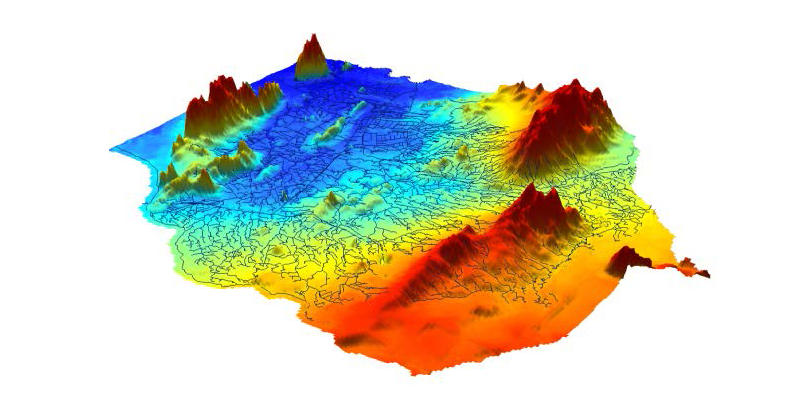
Figure 1: Topography in the area governed by the waterboard with the streams, canals and
rivers overlain (blue lines)
A hydrologic model is presently used to calculate and forecast the actual situation, the effects of the
climate change and the selected set of measures. All the measures are from category 2, because it is the
simplest way to meet the objectives. 10 km2 of designated flooding areas will be needed to handle the
effects of climate change.
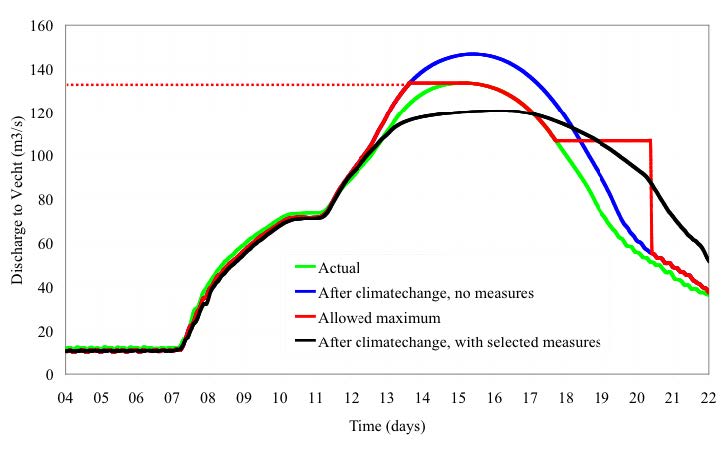
Figure 2: Discharges to the river de Vecht just North of the Regge and Dinkel area under
various discharge scenarios
Problem formulation. The mathematical challenge is to design a better set of measures with (a combination)
of the three strategies. Important preconditions are:
1. the rainfall-runoff reaction varies from very fast to slow, depending on characteristics of the subarea
2. every subarea has a different reaction on the climate change because of the rainfall-runoff characteristic.
3. the surface water system is quite complex with several division points.
4. as a wave travels through the system it deforms.
5. because of the travel time and deformation of the wave the resulting peak-discharge is not a simple
sum of all subareas.
The research questions are:
1. Is it possible to improve the results by a smart combination of the three strategies; and, is it possible
to reduce the area required to buffer the effects the climate change?
2. Given such strategy improvements, what would be the implications for water management?
3. Can a mathematical tool be developed, in principle, to increase the knowledge about the water
system and possible solutions measures to buffer and limit water discharge rates into de Vecht river?
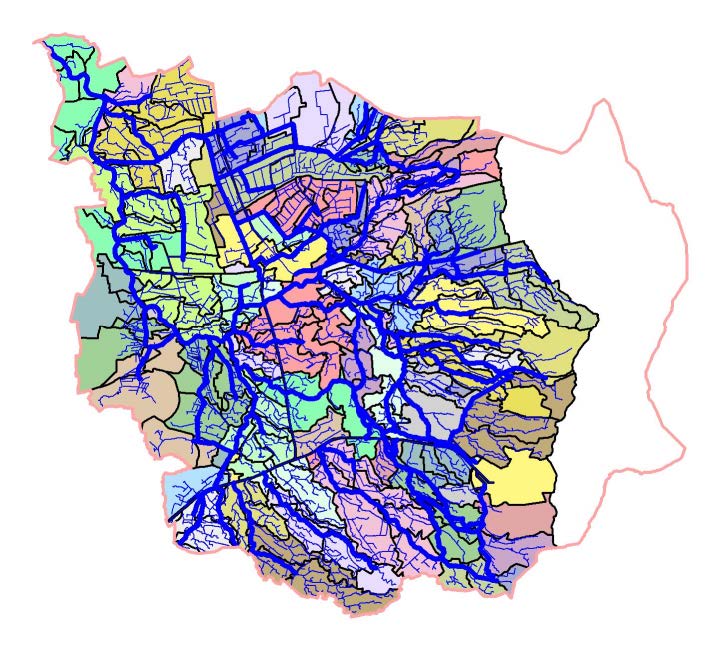
Figure 3: The water shed in the Regge and Dinkel area with discharge into the river Regge.
Dark blue thin lines denote the Twenthe Canals; thick blue lines indicate main
watering channels, and thin lines the smaller ones. The white empty area to the
right concerns the water shed with discharge to the river the Dinkel